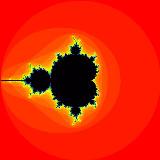
Mandelbrot Set
 To generate an image of the Mandelbrot Set or a Julia Set, a relatively
simple algorithm is used that requires the squaring of a complex number followed
by the addition of a constant.
In the region of the complex plane being investigated, each pixel position
is iterated through that simple equation, and the color of the pixel determined
by the behavior observed. In most cases, the color relates to the number of
iterations required before the value does one of two things: 1) it reaches
some maximum number of iterations, or 2) it becomes too large. A typical
method for deciding when an iteration is too large is to calculate the
distance from the origin to that point. If the distance exceeds 2 units,
successive iterations will get extremely large, approaching infinty.
if a value is too large, typically a test of the distance from the
To generate an image of the Mandelbrot Set or a Julia Set, a relatively
simple algorithm is used that requires the squaring of a complex number followed
by the addition of a constant.
In the region of the complex plane being investigated, each pixel position
is iterated through that simple equation, and the color of the pixel determined
by the behavior observed. In most cases, the color relates to the number of
iterations required before the value does one of two things: 1) it reaches
some maximum number of iterations, or 2) it becomes too large. A typical
method for deciding when an iteration is too large is to calculate the
distance from the origin to that point. If the distance exceeds 2 units,
successive iterations will get extremely large, approaching infinty.
if a value is too large, typically a test of the distance from the
The same basic algorithm used for both the Mandelbrot and Julia Set programs. Bothe fractals use Complex Numbers, and the only difference relates to the use of the constant that is added on each time. Here are the equations:
-
Zn+1 = Zn2 + C,
where Zn = an + bni and C = a0 + b0i
The value i of course stands for the square root of -1.
In order to graph the pixels in the coordinate plane, the above equation
is separated into its Real and Imaginary components for each arbitrary
point (an, bn).
The Real part is
graphed along the horizontal axis and the Imaginary part graphed along the
vertical axis. The equations to generate the next real or imaginary
portion is as follows:
-
Real Part: an+1 = an2 -
bn2 + a0
Imaginary Part: bn+1 = 2anbn + b0
It is also necessary to check the distance of that point from the origin after each iteration, so the distance formula becomes:
d = sqrt [ ( an+1 - 0 )2 + ( bn+1 - 0 )2 ]
Since the square root process causes the computer to do extra computation, it is often faster to eliminate that step and just check for when d2 is greater than 4.
Since it is wise to avoid unnecessary computation, it is a good idea to calculate the numerical position of each pixel. For instance, if a tiny Mandelbrot 10 pixels wide were to be drawn in the range -2 < x < +2, the first pixel would be drawn at -2 and the last pixel would be drawn at +2, but where would the other 8 pixels be located? To calculate this, the following rationale might help. With n pixels there will be n-1 intervals between them. Since the total distance between the starting and stopping point must be divided into n-1 equal intervals, this example becomes:
-
Total Distance = x2 - x1 = 2 - (-2) = 2 + 2 = 4
Number of Intervals = n - 1 = 10 - 1 = 9
Distance Between Intervals = Total Distance / Number of Intervals = 4 / 9 = 0.444444444...
An Interesting Aside
There was an interesting hoax about a Benedictine Monk ( circa 1200-1270 AD) who was reprted to be the first one to actually discover the existence of the Mandelbrot Set. Students should be aware that web resources are not reviewed for content nor can they be verified as accurate. However, the following link does make an amusing April Fool's Joke:
- http://www.raygirvan.co.uk/apoth/udo.htm - The Mandelbrot Monk by Ray Girvan
In any case, we who study science and mathematics are often just discovering principles that already exist. Surely there are many more discoveries that will be made in years to come, and those who are experimenting with concepts today may be laying the groundwork for future enlightenment centuries from now. We should applaud all those who contribute to and perpetuate knowledge in our society.
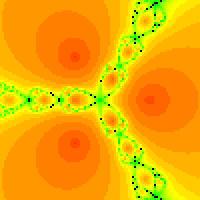
Julia Sets
 For the Mandelbrot Set, the value for C is the initial pixel position at the
start of each iteration sequence but for a Julia Set, the value for C is the
same for every iteration, regardless of the starting pixel
position. Most of the
constants that produce interesting Julia Sets are near the boundaries of
the Mandelbrot Set. Here are some
constants that produce interesting Julia Sets:
For the Mandelbrot Set, the value for C is the initial pixel position at the
start of each iteration sequence but for a Julia Set, the value for C is the
same for every iteration, regardless of the starting pixel
position. Most of the
constants that produce interesting Julia Sets are near the boundaries of
the Mandelbrot Set. Here are some
constants that produce interesting Julia Sets:
- C = -0.12375 + 0.56508i (Basin with one attractor)
- C = -0.12 + .74 i (Three Attractors)
- C = -0.11 + 0.6557i (Three arttractors but with slight spiral
- C = -0.194 + 0.6557i (Three-attractor Cantor Set)
- C = 0 + i (Dendrite filament near 3-attractor basin)
- C = -0.125 + 0i (Parabolic case: boundary between 2 and 4 attractors)
- C = 0.11031 - 0.67037i (Fatou dust near 7-attractor basin)
- C = 0.27334 + 0.00742i (Parabolic case near 20-attractor basin)
For either the Mandelbrot Set or a Julia Set, the region in the Complex Plane that is graphed is typically -2 < a < 2 and -2 < b < 2 . To zoom into a region, the values for the glOrtho( ) can be easily modified to produce a closeup view.
For more information on the Mandelbrot Set or Julia Sets, check out the
web page developed by
Sean Dobbs' Fractals: Mandelbrot
Set, Julia Sets, Orbits of Points
Interesting things to try:
- Use mouse routines to generate a zoom into any region of the Mandelbrot Set.
- Try plotting the path of selected points as they are iterated in the Mandelbrot set or specific Julia sets.
- Using mouse routines, interactively select points from the Mandelbrot Set to use for Constants in creating Julia Sets.
- Try higher order Mandelbrot type calculations: Z3 + C, Z4 + C, etc. What do the Julia sets look like?
- Create an animation to show what happens through fractional powers going from Z2 + C to higher powers of Z.
 Newton's method is a Calculus-based process used to arrive at roots of
high order polynomials. This iterative approach relates to a line tangent
to a polynomial at a specific point on the curve which can be used to
give a better approximation of the root with another iteration.
The process for general equations in the Complex Plane can be defined as:
Newton's method is a Calculus-based process used to arrive at roots of
high order polynomials. This iterative approach relates to a line tangent
to a polynomial at a specific point on the curve which can be used to
give a better approximation of the root with another iteration.
The process for general equations in the Complex Plane can be defined as:
- Zn+1 = Zn - [ f(Zn) / f'(Zn) ]
where Z moves from some initial guess to an approximation of the root through some maximum number of iterations. The iteration process can be halted when consecutive values of Z are within some arbitrarily small distance, epsilon, of one another.
To generate an interesting fractal, all points in some region of the Complex
plane can be colored in some way depending upon how these points converge
to the various roots or "Basins of Attraction". For example:
-
Given the function f(Z) = Z3 - 1
The derivative would be f'(Z) = 3Z2
The equation to calculate the next iteration will be
Zn+1 = Zn - [(Zn3 - 1) / 3Z2]
This function has three roots: the real number 1 and two imaginary roots, one near (-0.5 + 0.866i) and the other near (-0.5 - 0.866i).
An arbitrary point a + bi in the complex plane should eventually converge to one of these three roots, assuming the iteration process is long enough and the approximation technique does not divide by zero some where along the way.
Newton's Method calculations can be very computationally intensive though, especially since it will be necessary to eliminate values of i in the denominator of any fractions by using the complex conjugate. After that, isolate the real and imaginary portions of each calculation carefully since even a misplaced sign will significantly distort the picture. Look for ways to save on computation, too. The following page might be helpful for understanding more about Complex Numbers and DeMoivre's Theorem. It will show you some tricks for working with fractional powers.
For more examples of Newton's Method in the Complex Plane, check out:
- Newton's Method in the Complex Plane A Supercomp Page by former student Adrian Porter. He experimented with fractional powers in order to generate some intersting animations. With fractional powers, it is necessary to go to polar coordinates instead and apply DeMoivre's Theorem.
- Newton Basins A discussion of generating fractals using the Basins of Attraction for Newton's Method by Dr. David E. Joyce at Clark University
- Newton's Method Fractals A collection of graphic images generated by people in the Math Department at Iowa State University
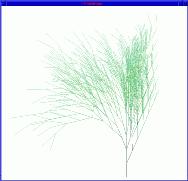 Some interesting graphics can be produced using a process developed by
Dr. Aristid Lindenmayer, a colleague of Dr. Mandelbrot. The technique has been
called "L-Systems" after Dr. Lindenmeyer, and involves recursive string
replacement using a set of simple rules.
Some interesting graphics can be produced using a process developed by
Dr. Aristid Lindenmayer, a colleague of Dr. Mandelbrot. The technique has been
called "L-Systems" after Dr. Lindenmeyer, and involves recursive string
replacement using a set of simple rules.L-Systems can be used to generate rather complex graphic images from some simple rules that define such things as lines, polygons, angles, and such. For each L-system, a set of string replacement rules are defined, and the objects defined in the string are graphed after a certain number of iterations have been applied. In a book by Prusinkiewicz and others titled The Algorithmic Beauty of Plants, a number of incredibly realistic biological images such as flowers, trees, and ferns are defined by these relatively simple rules.
For more examples on L-systems, check out:
- L-Systems - A Supercomp Page by former student Tom Dixon
- An Introduction to Lindenmayer Systems by Gabriela Ochoa at the School of Cognitive and Computing Sciences at the University of Sussex
- Modelling of Plants and Fractals with Lindenmayer Systems A collection of Web references by Christian Jacob in Germany