
 |
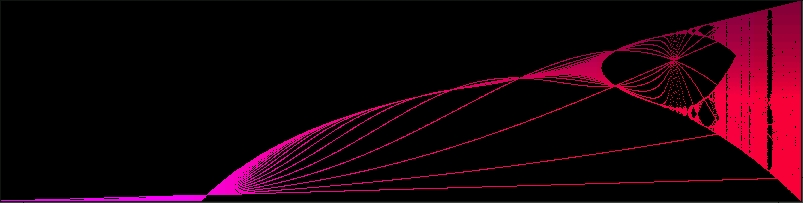
The equation is y=kx(1-x) with k varying from 0 to 4, and x from 0 to 1.
For each value of k, 50 iterations are calculated and plotted with the result (y) becoming the new x value.
The for lower values of k, the function converges to one value.
Then as k increases, the function bifurcates, oscillating between two values, and finally collapses into chaos.
- 2/10/98 -
bifurc.cpp
|

 |
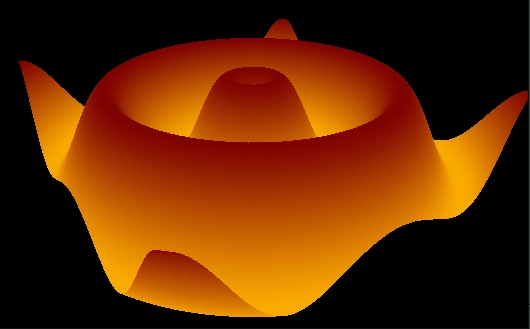
This 3d landscape is a sine wave extending out from center.
I calculated the distance from the center point, then varied the height by the sine function.
Some *extras* : rotating the object, changing perspective, changing the height of the ripple, flipping the function, changing the period of the function, and changing the distance of the wave from center.
- 3/12/98 -
ripple.cpp
|
 |
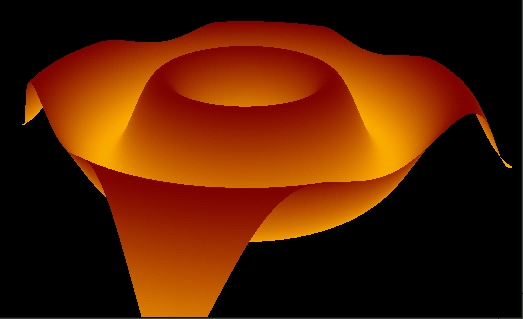
This is was my original intent when I began Ripple (above).
Because of a silly mental error, I created a ripple effect instead of the half torus I intended to make.
I calculated the distance from center, then varied the height by the square root of the radius (aka the height of the ring) squared plus the distance from the ring radius.
- 3/13/98 -
halftor.cpp
|
 |
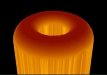
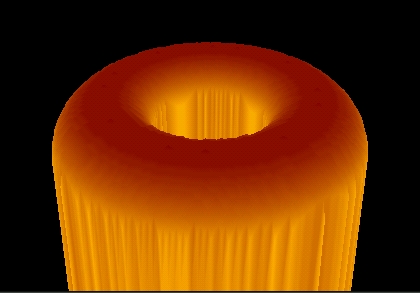
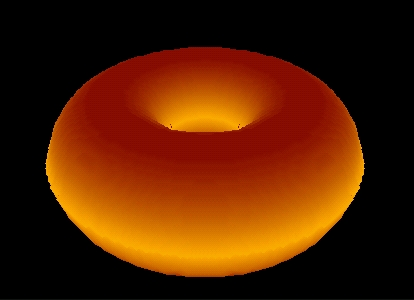
Hungry?
It reminds me of a doughnut - yum!
I modified Halftor (above) to draw only the sections that were part of the torus.
I also made it plot the negative altitude, which finishes the underside of the ring.
- 3/17/98 -
torus.cpp
|
 |
The infamous Mandelbrot Set.
The real and imaginary parts of the function vary as x and y.
The color is determined by the number of iterations required for the point to escape.
In each iteration, the new x (real) value is calculated by squaring the the previous x value (xnew), subtracting the square of the previous y value (ynew), and adding the original x value (cx).
The new y is caluculated by multiplying the previous x and y values by 2, and then adding the original y value (cy).
The point has escaped the set once the distance from the origin is greater than 2.
- 3/24/98 -
mandelbrot.cpp
|
 |
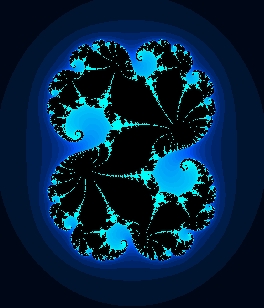
The Julia set is a modified Mandelbrot set.
Instead of the cx and cy values changing with each point on the screen, they stay the same value for all points on the screen.
However, the starting value for the x and y (xnew and ynew) do vary according to the coordinates of the point.
Otherwise, the escape function is the same.
- 4/12/98 -
julie.cpp
|


|
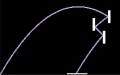
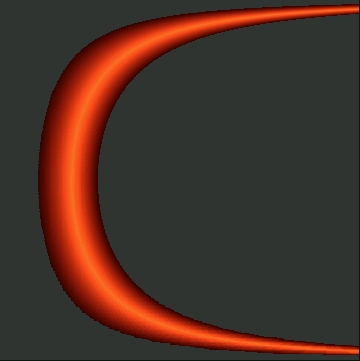
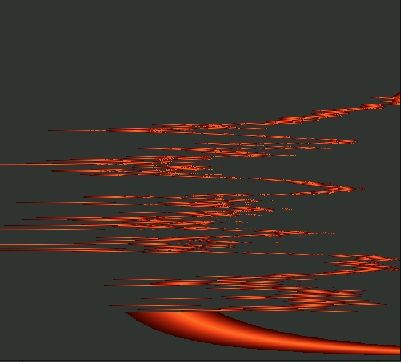
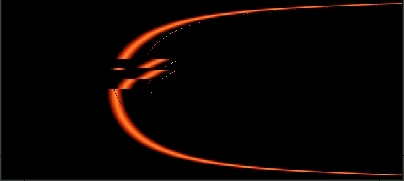
For each velocity and angle, the distance the projectile will fly is computed and then plotted a certain color based upon the difference between the desired target distance and the calculated distance.
In cases with no barriers, the solution set looks much like a sideways U.
However, placing barriers will disrupt the set, as seen on left.
The third image is taken from the test program that checks that the algorithm works correctly.
- 5/1/98 -
missile.cpp
And, if you so wish, here's the code for the test case
- 5/1/98 -
miss2.cpp
|
 |
This is the PVM (Parallel Virtual Machine) version of missile, above.
Each package sent to the slave machines was a section of the graph to calculate.
They then sent back to the master the RGB values for each theta and velocity they were given to compute, and the master plotted the points.
PVM ideally would decrease the amount of time needed to run because the tasks would be split up among several computers.
However, there is overhead involved with the sending and receiving of the task packages, so at this level, I did not find the PVM version to be that much (if any) faster.
- 5/26/98 -
Mmissile.cpp (master program),
Smissile.cpp (slave program)
|

|
POVRay!
I used POVRay to create these scenes.
A julia set is mapped onto the torus in the top image.
The second image is just for fun.
Bluetor is also ANIMATED.
- 6/2/98 -
bluetor.pov,
reflect.pov
|
Back to the top

 jding@tjhsst.edu