 source
 Our first project involved iteration and bifurcation. If these words sound strange to you, don't worry, they're just fancy names for a couple of simple ideas. Take iteration for an example. If you've ever used a calculator, you've probably amused yourself once or twice by pushing the buttons on that calculator and seeing what happens. Let's look at the square function, which is, in mathematical terms:
f(x) = x2
On most calculators the square function is represented by a button with an "x2" on it. When you push the button, the calculator takes the number on the screen and squares it (unless you're using a graphing calculator, in which case you might have to push a few extra buttons, but the idea is the same). So if you enter the number 2 and then press the square function key, it will display 4, since:
f(2) = 22 = 4
If you press the square function button again, you'll get a 16 because:
f(4) = 42 = 16
If you keep on pressing that button, you'll get a sequence of increasingly large numbers:
f(16) = 162 = 256
f(256) = 2562 = 65536
f(65536) = 655362 = 4,294,967,296
And so on. You have just done an iteration, since iteration is just doing something repeatedly, using the previous results as your starting point every time you start over.
For our project, we looked at the logistic function:
g(x) = k * x * (1 - x)
and we only looked at values of k from 1 to 4 and x from 0 to 1, since only those values make interesting graphs. Now, we could have just chosen a couple values, iterate through them, and print out all the numbers, but it is tough to analyze pages of lists of numbers, and, admittedly, we are a bit lazy, so we decided to let the computer graph the results for us.
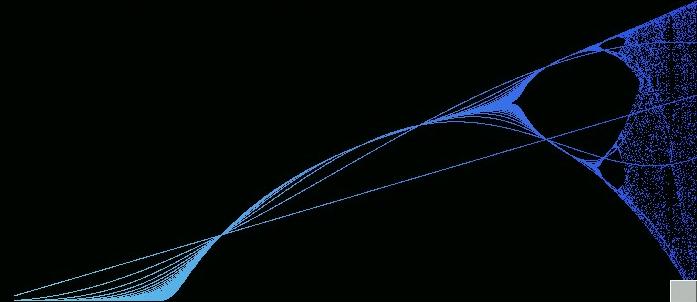
We went through the values of k we had chosen before and each time, we gave x the initial value of .2 as a compromise between the wild graphs of smaller values of x and the more sedate graphs of larger values. For each iteration we plotted the point (g(x), x).
If you look at the graph, you can see that the graph first tends toward zero and then increases like the logarithmic function. Then, all at once, the graph splits into two lines, or bifurcates. It is too small to see in this picture, but if you analyze the function very closely, you will see that the graph is actually bouncing back and forth between the larger and the smaller values. The graph then bifurcates again and then goes into chaos, in which it stays until the end of the graph.
So, as you can see, computers can be used to make analyzing a lot of data easier, but they can also be used to do more fun projects...
Look at the graph produced and the source code for the program: