Almost everyone has seen a fractal before, those beautiul and complex images that seem to go off to infinity, and they are one of the staples of any computationally intensive course. However, not many know how they are made. The most famous fractals, the Julia and Mandelbrot sets, are also some of the easiest to make.
Fractals are based on complex numbers, which are numbers like 5+2i where the 5 is called the real part and the 2i is called the imaginary part. Complex numbers are graphed on a grid much like normal numbers, except that the x-axis is called the real axis and the y-axis is called the imaginary axis. For example, 5+2i would be graphed as:
          ^  Imaginary axis
          |
          |
          |        . (5+2i)
          |
<---------+---------->
          |       Real axis
          |
          |
          |
          v
In each of these fractal sets, you take each point Z and use it in the equation
Zn+1 = Zn2 + C
where Z and C are both complex numbers
until the new point gets either farther than 2 units away from the center (or origin) of the graph or until you have done this more than a certain number of times (otherwise you would be doing this forever on some points). Then you color in the original point wiht some color based on how many times you did the equation
The only difference between the two types of fractals is what they use for C. The Mandelbrot set uses the value of the point you're working on, while the Julia set uses a constants value for C that is specified whe you start the program.
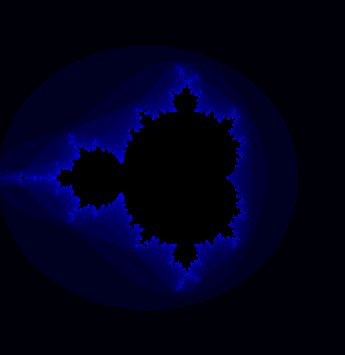
Here's a picture of the Mandelbrot set:

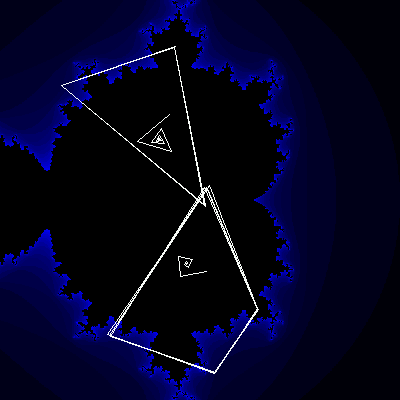
If you plot the values you get while doing the mandelbrot equation for a certain point, you can find some interesting things. As you can see in the picture below, oints near the middle of the set spiral in towards a certain point. However, if you pick a point in one of the bulbs coming off of the main set, you will see that the values follow a pattern. A point in the top big bulb has values near three different points, so it has a period of three. As you get closer to the real axis, the periods of the points in the bulbs increase by one per bulb, but between the top big bulb and the next biggest bulb (to its right) the periods increase according to the fibbonacii sequence (1, 1, 2, 3, 5, 7, 12, 19...).
